top of page
Logo.PNG
Logo.PNG
Search

Abstract : Moving SQL servers from om on-Prem to AWS could be challenging and overwhelming, in this blog I will shed some light on RDS instance sizing and migration best practices to SQL Server RDS.

Introduction : The journey to the AWS starts first with picking the right RDS instance and second the right migration path. In this blog, we will not go into details on SQL server on Prem assessment and how to right size your workload, this is for another blog coming soon so stay tuned. Picking your instance means finding the instance family that most closely matches the CPU and memory for on Prem SQL Server instance. AWS RDS provides a wide selection of instances, which gives you lots of flexibility to right size your compute resources to match

capacity at the lowest cost. There are several families of RDS instances. These database instance families are optimized for memory, performance, and I/O:

  • Standard performance (includes the M3 and M4 instance types) – Designed for general-purpose database workloads that don’t run many in-memory functions. This family has the most options for provisioning increased IOPS.

  • Burstable performance (includes T2 instance types) – For workloads that require burstable performance capacity.

  • Memory optimized (includes the R5, X1, and Z1 instance types) – Optimized for in-memory functions and big data analysis.

Full listing of all SQL server RDS instances can be found in this below link: https://aws.amazon.com/rds/sqlserver/instance-types/


AS previously discusses the first step is to pick up the right RDS instance to match on Prem SQL Server, but this step could be overwhelming especially if you are dealing with mass server migration. To help with this task I am introducing “RDSInstanceTool” . What is RDSInstanceTool ? RDSInstanceTool is a free no impact tool that helps you with matching you're on Prem SQL server with the right RDS Instance based on CPU and Memory allocation. The tool will read your SQL server Memory, CPU count and present you with the right instances on RDS for General purpose or Memory optimized. Downloading and Installing RDSInstanceTool The tool is available at Github Installation Steps:

  1. Extract RDSSqlServerInstanceTool.zip on c:\RDSSQL as shown below


The tool has 2 files RdsInstanceTool.exe and RDSSQLInstances.xlsx

2. Create an input file that contains a list of all your SQL Server that you are trying to match with RDS Instance and place it in c:\RDSSQL .A sample file can be found in GitHub.

You can use IP address or SQL Servername and if the port is different from the

default port, enter the port as well . 3. Installation complete Running RDSInstanceTool


  1. To execute open a CMD prompt navigate to c:\RDSSQL and type:

C:\RDSSQL>RDSqlServerInstanceTool.exe login password file type

Login: Sql server login ( sa password or login with access to DMV )

Password: Sql server login password

File: the input file created in step 2

Type: M- for memory optimized instances

G- for general purpose instances


Output: The output will look like the screenshot below:


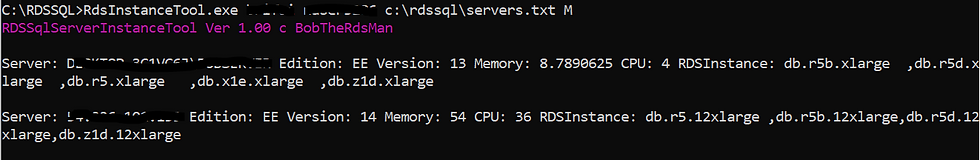
A great effort is made to match your on Prem resources with the right RDS instance. Few things are considered while matching your resources with an RDS instance: 1- Not all instances are available for all SQL Server version and edition. A complete list of instances per Sql server edition and version can be found in this link

2- I try to match your CPU first with the RDS instance and this means that it is possible that

the instance that I am suggesting could be overprovisioned on RAM. For example, in the below screenshot server #2 has 36 CPU and 54 GB RAM allocated,


the closest that I can match with 12xlarge which is 48 CPU and 192 GB RAM.

Downsizing to 8xlarge will end up well below the 36 CPU. So, review all suggestions

and refer to the below link to adjust to the right instance that works for you at the end

of the day you would know your need and your server requirements.

RdsSqlServer-Instanceype 3-the tool as of today will only match standard and Enterprise Edition with a minimum

of 4 CPU (Xlarge)

4-I give all possible matches as per CPU and memory.

What’s Next

RDSInstanceTool V 2.00 will be able to run a full assessment on your on Prem server (CPU an Memory) based on a defined collection time and give you an RDS instance type based on your actual load not your server configuration.

Migration: To migrate your SQL server to RDS you have multiple options: 1-Using Amazon S3 and SSMS https://docs.aws.amazon.com/prescriptive-guidance/latest/patterns/migrate-an-

Migration Workshop:


Related resources References

Tutorials and videos

17 views0 comments
  • Writer's picturebobtherdsman

Updated: Feb 6, 2022


One of the biggest chanlleges moving a DB from on Prem to the cloud is determining the right Instance Size. Although we have several available tools that asses the on prem DB and can help with instance sizing but quite often we tend to forget that there are few things that we can do at the DB level itself that help minimize IO and storage and therefore help in choosing the right class instance and as a result save money.


First and for most it is very important to get a performance baseline of the Server and DB.

There are specific steps that should be taken when analyzing a workload with the goal of making the application perform better, while at the same time reducing resource consumption.

There are a lot of ways to do that but for the sake of this article we can keep it simple

Baselining is important because you need to know as you are working on IO optimization whether you are going in the right direction or not.


To baseline your Sql Server load you can capture below stats (more about the counters and Waitstats in the Appendix section).

NB: Taking a baseline and running a POC will be covered in a later posting.

· Perfmon (Windows)

· Waitstats (Sql Server)


After baselining your DB we can go ahead and dig deep into the Database and start looking at few but imoprtant things that could make a difference in performance and IO optimization.

NB. : all script for below operations can be found on Github


1. Duplicate indexes

2. Missing Indexes

3. unused indexes

4. High IO Queries


1. Duplicate indexes

Indexes are very powerful in SQL Server. You want to have the right indexes in place to help support queries reading table and make them faster– that has a lot of benefits, like reducing IO, CPU, and memory usage. But on the flip side, you can easily have too much of a good thing. Duplicate indexes (or overlapping) take up double the room in SQL Server– and even if indexes are COMPLETELY identical, SQL Server may choose to use both of them. Duplicate indexes essentially cost you extra IO, CPU, and Memory, just the things you were trying to SAVE by adding indexes!

Dropping duplicate indexes will reduce the size of your DB minimize IO and CPU.Please review the Output carefully and test in Dev before dropping any indexes, I will highly recommend to drop few sets at a time and make sure to document your steps.


Running the script against Adventureworks generated below output, ‘Document’ table has two identical duplicate index. in this case one of them can be safely dropped.


2. Missing Indexes

When SQL Server is processing a query, it will sometimes suggest an index that it believes will help that query run faster. These are known as Missing Indexes, or Missing Index “Suggestions”.

Missing indexes can really help in optimizing the queries with High Read and

Will as a result reduce IO, CPU and memory utilization.

Now, before we get too far into this, let’s start with a warning. You don’t want to take SQL Server’s indexing advice TOO literally. You want to take it as a starting point and then decide: is this good advice? What’s the best way I could use this.

But few things you need to be wary about the missing indexes “suggestion “

o They’re super specific– and they don’t consider each other. If you follow the missing index recommendations exactly, you’re very likely to create indexes with duplicate keys and /or duplicate include values.

o They don’t consider existing indexes on the tables. There may be an existing index which is just like the missing index, but it needs one added included column. The missing index recommendations will just tell you the exact index that would be perfect for them.

o Sometimes it will recommend an index that already exists.

o Missing index information is cleared on SQL Server restart.

o On SQL Server 2012 and above, missing index info (and info in index usage and operational stats DMVs) may be cleared when you rebuild an index as part of index maintenance

o Some of the suggested indexes could overlap and they could vary slightly in order or Included columns

3. Unused Indexes

Are too many indexes bad? will it depends and this is for later discussion but

one thing we know for sure is unused indexes cause performance issue, higher

IO consumption, longer maintenance Jobs and larger DB size.

As a rule of thumb, we should look at index stats “Read and Write”

and drop all indexes that have Zero or low write as supposed to read.

unused indexes cause unnecessary Db Growth More read and more maintenance

on your DB Another word of caution as well:

To interpret this information, we need to know how usage is calculated. Index

usage information is persisted since SQL Server’s restart and in Sql 2012 and

higher index usage data is wiped out when you rebuild the respective index.

You may also have cases where indexes are only used at special times, but are

still very important. (i.e. monthly, quarterly and yearly reports)


  1. USER_SEEKS refer to how many times an index seeks occurred for that index.

  2. USER_SCANS refers to how many times an index scan occurred for that index.

  3. User_LOOKUPS refer to how many times the index has been used in a "bookmark lookup" to fetch the full row. This is because non-clustered indexes use the clustered indexes key as the pointer to the base row.

  4. USER_UPDATES The updates refer to how many times the index was updated due to data changes which should correspond to the first query above.

4. High Logical Read

This will be one of most time-consuming exercise but for sure the most rewarding in terms of reducing IO, CPU and Memory usage and improving the Overall performance of your DB. The Idea here is to get the top 5-10 queries with the highest IO read and tune those queries, you may not need to tune a query that is high in read but runs once or twice a day vs a query that is avg in IO but runs every few minutes the reward here is much higher.


Conclusion:

Index tuning can be very difficult at first but there are a lot you can learn buy conducting this exercise. In general, adding the right indexes– and taking the right indexes away– are some of the best things you can do for your SQL Server’s performance and optimization. I would personally start working on the duplicate indexes first as this is the safest operation you can carry. And always make sure you test your change in a test box and take Sql Server stats before and after .


Appendix


WAITSTATS

Anything that Sql server execute that has to wait for a resource - A lock or a page that needs to be read from Disk, Memory Grant... will have a waitstats associated with it and Sql server will record the wait and the time. Waitstats are very important to understand to have a good picture about your Sql server and DB. It is also important to note that those Waitstats are cumulative from the time Sql server start or from the time a manual reset has been issued.For better reading of Waitstats I suggest scheduling a sql agent job to collect and store the metrics into a table.

You can refer to this blog written by Paul Randal about Waitstats https://www.sqlskills.com/blogs/paul/wait-statistics-or-please-tell-me-where-it-hurts/


Perfmon

Perfmon is a windows task you can schedule the below Performance counters( detailed description of the counters in Appendix A) for 30 minutes to one hour during peak time to get a good reading about the DB performance.

OR you can use Free Tools for the DBA: PAL Tool , it is simple and easy to use and comes with preconfigred counters .

CPU Usage

· Processor

o %Processor Time

o %Privileged Time

· Process (sqlservr.exe)

o %Processor Time

o %Privileged Time

Memory Usage

· Memory

o Available Mbytes

· SQL Server:Buffer Manager

o Lazy writes/sec

o Page life expectancy

o Page reads/sec

o Page writes/sec

· SQL Server:Memory Manager

o Total Server Memory (KB)

o Target Server Memory (KB)

Disk Usage

· Physical Disk

Avg. Disk sec/Read

o Avg. Disk Bytes/Read

Avg. Disk sec/Write

o Avg. Disk Bytes/Write

· Paging File

o %Usage

· SQL Server:Access Methods

o Forwarded Records/sec

o Full Scans/sec

o Index Searches/sec


Tools

These are some of the tools that I used it is not by any means a complete list , and some of those tools are quite old but they still work and provide a lot of values. SQLDIAG: https://docs.microsoft.com/en-us/sql/tools/sqldiag-utility?view=sql-server-ver15


49 views0 comments

CONTACT

Thanks for submitting!

bottom of page